Working with the Explorer
Each Explorer page utilizes three core components: a filter panel on the left, data table and the data visualization in the center.
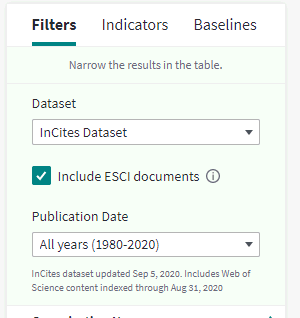
Dataset: Choose the default InCites dataset based on the Web of Science Core Collection data or one of your Custom Dataset containing the documents you want to analyze from Web of Science Core Collection.
ESCI Documents: The checkbox allows you to add or remove documents and citations from the Web of Science Emerging Sources Citation Index (ESCI). This checkbox is also available in Overview Reports.
Publication Date: Choose a time frame for all the source documents to begin you analysis. You can select one of the multiple options available or choose your own using the Custom Year Range; the start year is 1980.
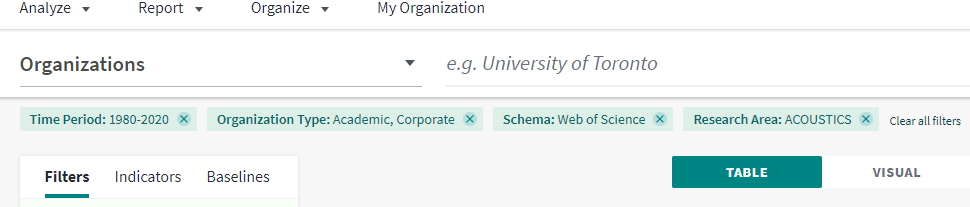
Filters: Filters are one of the three tools you can use to analyze data in the InCites B&A. When applying filters, data table and visualizations can be transformed to identify lists of People, Organizations, Regions, Research Areas, Journals, Books, Conference Proceedings, and Funding Agencies that meet your focus. Filters are available in all analysis contexts. You can apply one or many filters in order to drill-down on a specific entity. You can use filters to include or exclude entities.
The filters you have applied are now visible at the top just below the Header.
Visit our Filter Cheat Sheet help page for more information
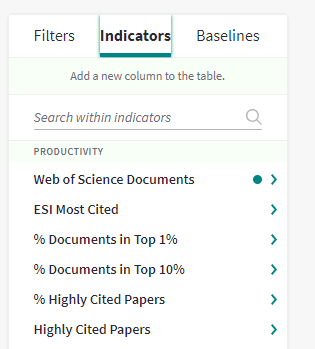
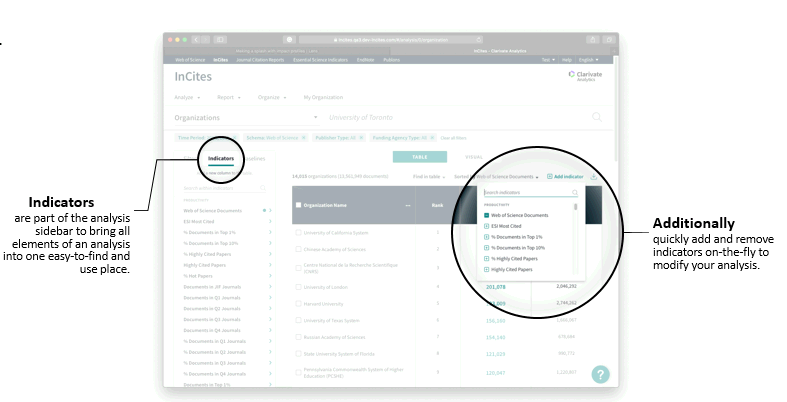
InCites supports a comprehensive class of advanced bibliometric indicators assessing various aspects of research performance. More information is available in the Indicators handbook.
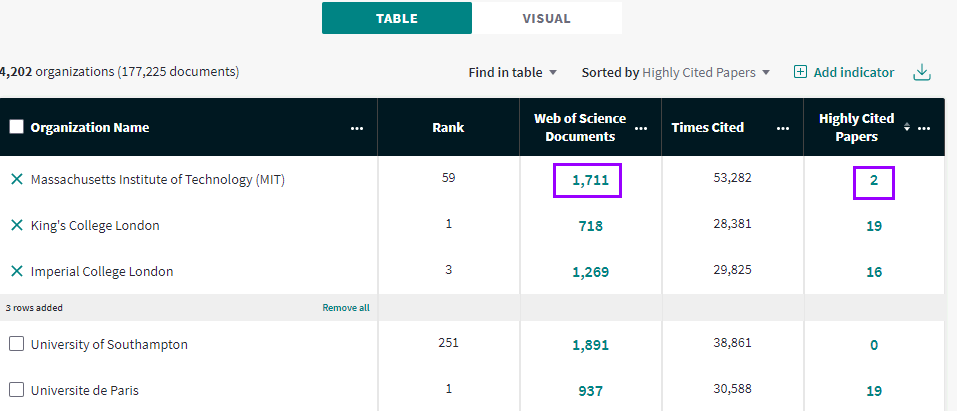
You can search, review and add an indicator using the left panel or if you already know which indicator you want to review, use the “Add Indicator” above the data table to quickly search and add an indicator using one-click.
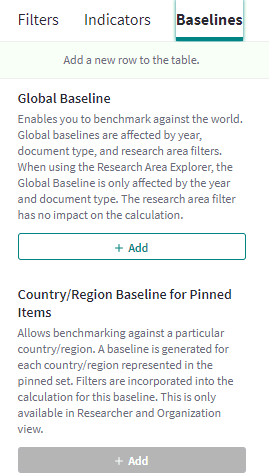
Baselines help you see how the information for the performance indicators selected compares against calculated totals. Baselines consider all documents in a given set and generate ad hoc indicators based on the document set and vary depending on the Explorer focus you're using. Currently, baselines are available for:
- Global Baseline. Enables you to benchmark against the world. Global baselines are affected by year, document type, and research area filters.
- Baseline for All Items. Baseline for all items in the results data table. Filters are incorporated into the calculation for this baseline.
- Baseline for Pinned Items. Baseline for all results pinned from the data table.
- Country/Region Baseline for Pinned Items. Allows benchmarking against a particular country/region. A baseline is generated for each country/region represented in the pinned set. Filters are incorporated into the calculation for this baseline.
- Dataset Baseline. Available only for a custom dataset and enables you to benchmark the current custom dataset. Dataset baselines are affected by year, document type, and research area filters.
A note on Global Baselines: When using the Research Area Explorer, the Global Baseline is only affected by the year and document type. The research area filter has no impact on the calculations.
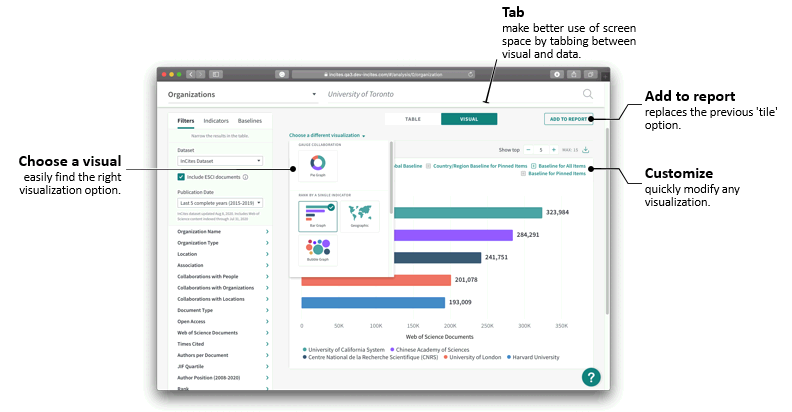
Quickly toggle between visualization types and indicators represented by selecting from the drop-down lists above the visualization to find the combination that best works to display the information you need. Expand or reduce the number of items from the results table that are included in visualization by clicking the - or + button. Hover over any segment of the visualization to see its associated data.
The following table describes the ten primary visualization types are available for all filter combinations.
| Type | Description |
|---|---|
| Geographic | Data results are displayed as highlighted locations on a world map. |
| Trend Graph | View trends in data over time based on the indicator selected. |
| 5-Year Trend Graph | The 5-Year Trend Graph groups documents and citations accumulated in the same five-year period. Trend lines on multi-year graphs tend to appear more stable than those illustrated on single-year graphs. |
| Bar Graph | View data arranged as bars of different lengths. |
| Bubble Graph | Data from results are displayed as bubbles whose size is related to the value for the indicator selected. High values will display as larger bubbles. |
| Treemap | Displays data as rectangles that are sized and arranged in order of quantitative value from largest in the top-right corner to smallest in the bottom-left corner. |
| Pie Graph | Displays data in a circular chart divided by differing proportions based on the numeric value of the data included. |
| Radar Graph | Radar graph plots your results in a two-dimensional chart, allowing you to see how multiple results compare along multiple indicators. Each indicator is represented by one of the outward pointing spokes, with lines drawn connecting data points. |
| Scatterplot | Three-dimensional visualization that allows you to specify values for an x-axis, y-axis and points along both. The size of the point is adjusted based on the indicator you select. All indicators are available for each axis and the point size. Average values for each axis display as dashed lines. Possible uses for this visualization include benchmarking an individual's research against their peers, or to identify research strengths using any measures of output, impact and collaboration. |
| Impact Profile | Available at the levels of Organization, Location, Journal, and Funding Agency entities. This allows you to effectively visualize and compare research performance across multiple entities. Comparison is always a sound path to improved understanding and interpretation. More information is available here. |
In addition, two collaboration-specific visualizations are available when you select the collaborations with filter:
| Type | Description |
|---|---|
| Collaborations | Displays the relationship between the focal entity and those entities with which collaborations have occurred on published documents. Available when the 'Collaborations with' filter has been selected. |
| Collaboration Network | Available in the People Master Tile, this visualization links authors by their co-authored documents. |
Organize Results
InCites makes it easy to organize and collect your results into peer groups, customize the indicators by which you rank and visualize information, and benchmark against calculated averages. By using tools that allow you to choose which items to view or exclude, you can gather the results you need to create the tile that captures information to help build your reports.
Quickly and easily find the items you need from the results list by searching. Enter your desired terms in the search box located above the data table and press Enter.
Pinning
Pinning items in the data table allows you to easily locate in the table people, organizations, regions, research areas, publications of interest and funding agencies in your analysis. When you find an item in your results, easily move it to the top and collect that item along with others by checking it and clicking Pin to top.
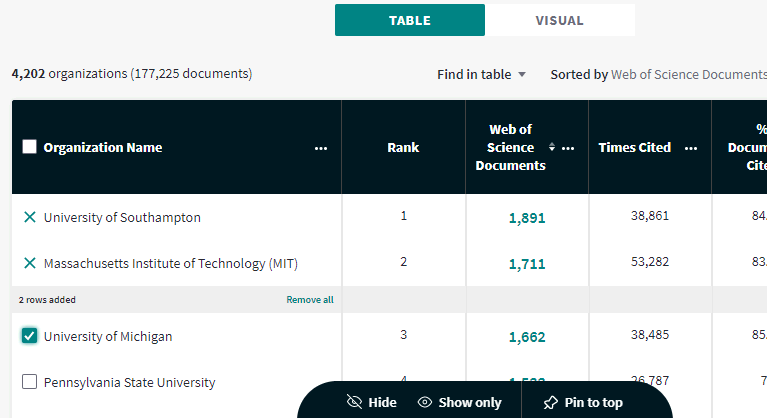
All pinned items appear together above the data table. The visualization prioritizes these items above other items in the data table. In addition, pinned items will remain after you navigate away from the page or sign out of the system.
Document List View, Refocus, and Export
Clicking on the hyperlink for any element in the results table in the Web of Science Documents column will bring up the Documents List View. This includes details on each article that contributes to the total count. A range of indicators are included to provide additional information at the article level. The Document List is also available for all but Global Baseline.
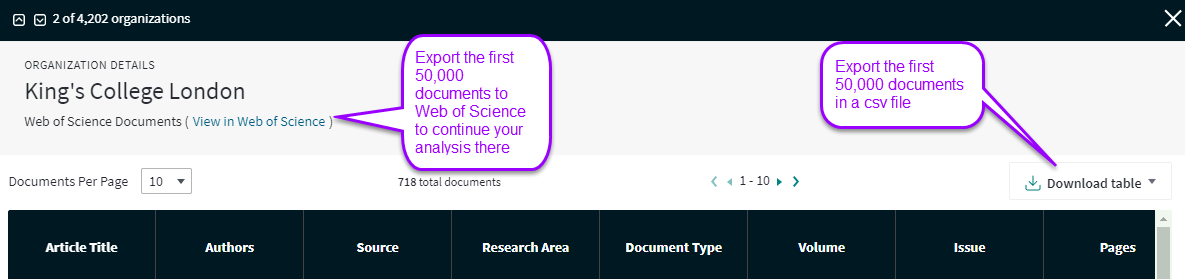
Within the document list view, users can access the corresponding Web of Science record by clicking on the article title. Based on your subscription to Web of Science index, either full record or a partial record is displayed.
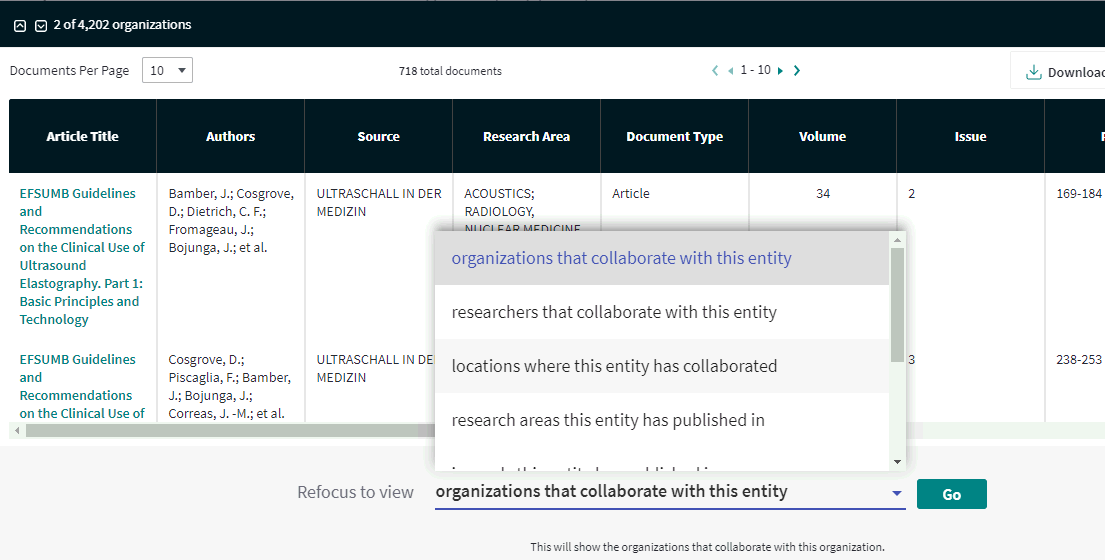
Results in the Document list window can be refocused to view that entity by its attributes that correspond with the other entities. Refocusing your view is a dynamic method that allows you to explore the relationships between and transition among the entity types of the InCites dataset.
For example, find a researcher within the People master tile and refocus your view to see how that researcher relates other master tiles. Quickly and easily uncover the People, Regions, and Organizations with which the researcher is affiliated or has collaborated or see the Research Areas and Journals in which they published by selecting the chosen area from Analyze Attributes.
Filter attributes will carry over to the master tile of your new focus.
Within the document list window, you can export the first 50,000 documents to Web of Science or in to a csv file.
By exporting the document to Web of Science, you can analyze them in various ways, including:
- Analyze the citing documents (as long as they are less than 10K): Where is this group cited? when? in which category do they have an influence on the discovery process? Who is funding the citing research? What is the geographical impact of these papers, are they cited in China or Europe? etc.
- Save these documents in marked list. Use the marked list to see if they get cited by the other Web of Science indexes.
- Export them as a search strategy to pass it to a colleague.
- Read their full text
- Export them to EndNote and cite them
Download Table
Clicking on the download table link allows you to download directly to your desktop the data contained in the results table for the view of the Explorer you are working in or within the Documents List view. Name your file and the number of records you want to include by either directly entering the number or using the directional arrows. Click Export to complete the task; the file will download to your computer. Data is limited to 50,000 entries in any category, and to the first 200 author names per document.
Data exports also include baseline information and a data and export timestamp, so you are aware of the content in your reports and can confirm the date you created the report. The data timestamp is identical to the date in the InCites Explorer Filter Summary.