Getting Started
Explore Data. Create Tiles. Save & Share.
You can create a customized view of the InCites dataset by using the Analytics Explorer. It's a single-page toolkit for analyzing InCites data and creating tiles, and a vehicle for delivering visualized data to your dashboard or sharing with colleagues. Create reports and include tiles, and save your reports in folders for you to access any time.
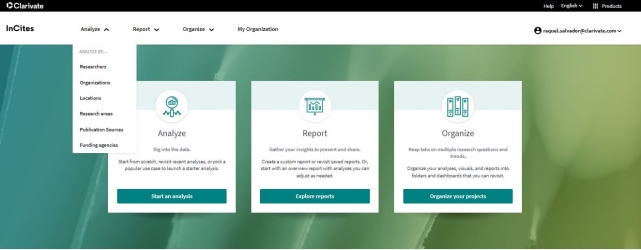
The explorer includes six master tiles, with each providing a different view of the InCites dataset. You can direct the focus of your analysis by Researchers, Organizations, Locations, Research Areas, Publication Sources and Funding Agencies. In addition, several InCites system reports are available to supplement the information you gather from main tiles.
InCites 2.0 is built on a single dataset source from the Web of Science™ Core Collection, aggregated by the Research Analytics Integrated Metrics System, and optimized in the InCites dataset.
Integration across the Research Analytics platform means indicators from Essential Science IndicatorsSM, Journal Citation Reports®, Institution Profiles and all InCites 1.0 modules come together in one dataset explorable in InCites 2.0
Institutional Registry/WAAN address unification system supplies organization data to InCites improving accuracy and ease of use.
Exploring the InCites dataset is the first step in delivering the visualized data that helps you understand the global research landscape and support strategic decision making.
Select a master tile from the explorer that provides the view of the InCites dataset you want to analyze. Explore data by doing the following:
- Apply Filters - use the filter panel to identify the attributes by which you wish to discover data.
- Pin Results and Benchmarks - pick and choose items from the results list to create a peer group to compare to each other and calculated benchmarks.
- Choose Indicators and Visualizations - rank your results by a specific Indicator and select a visualization that best conveys the information.
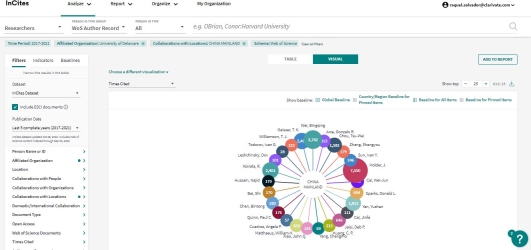
See our example where we applied filters to give us a view of Researchers in which researchers at the University of Delaware collaborated with researchers in China. The results are ranked by Times Cited.
Once you have narrowed your focus and discovered the information that best fits your needs, you can capture that data and an accompanying visualization by creating a tile.
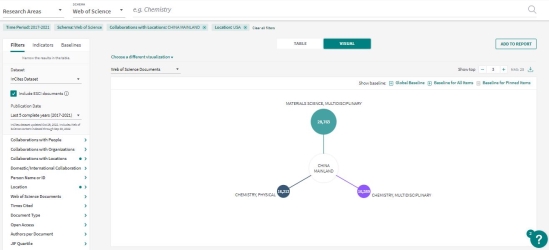
In Explore Data, we selected a series of filters that yielded data on the top research areas that involved US researchers collaborating with researchers from China, ranked by Web of Science Documents.
To capture this data as a tile:
- Select and Pin Data - the top ten research areas have been selected and pinned.
- Choose a Visualization - select the visualization type that best conveys your data. Collaborations has been chosen for this example
- Arrange by Indicator - the results for our visualization are ordered by Web of Science Documents.
Our master tile is customized so we can view the top research areas in which researchers in the USA and China collaborated, ranked per the data by Web of Science Documents and visually by Web of Science Documents.
From this, we can create our own unique tile and save it to a report we already created.
- Click ADD TO REPORT on the master tile page.
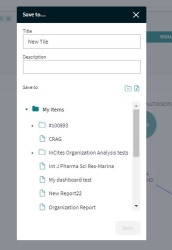
- Add a Titleand Description on the pop-up that appears.
- From the Save To drop-down, select a report from the folders that appear.
- Click Save.
Our newly created tile can now be found in the report to which we have added it. All reports are located within My Folders, located on the Analytics homepage. By default, you can find the first report you created within the My Items folder.
Share
Once you create a tile, you can find it on your dashboard or saved to a report.
The tile we created in the previous section can be seen on the dashboard example. From the dashboard, or folders you can share your report with anyone. Learn more about sharing reports.
Click the Share option and type an email address and message to the recipient and click Send.
Save
From the Dashboard, you can also save the tiles you accumulated and arranged as a report to a folder by clicking the Save As icon ![]() located in the navigation header. You can also create a new folder at this step, if necessary.
located in the navigation header. You can also create a new folder at this step, if necessary.


